Vendor Statistics |
||
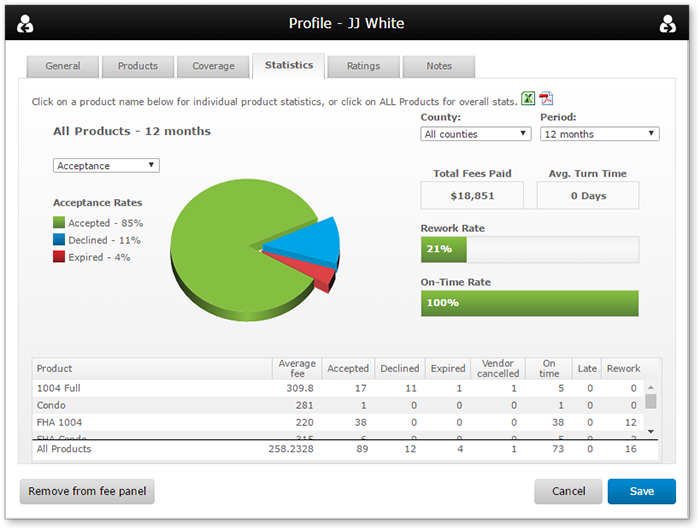
To help you get an idea of a vendor's performance for orders from your company, click the Statistics tab.
- Use the dropdown on the left to choose which statistics to view: Acceptance, rework, or late reports.
- Use the dropdowns on the upper-right to filter by county and timeframe
- Click an individual product name from the list at the bottom to filter the graph by that specific product. By default, All Products is selected.
- Click the PDF and Excel links to export the stats currently being viewed for use outside of Mercury Network.
Acceptance Statistics
This lets you know how conscientious a vendor is about responding to your orders. When a vendor is responsive, it saves you time from either calling them or have precious time tick away on an assignment. The percentages are color-coded so at a glance you can see if a vendor is performing well or not.
- If the rework rate is 0-30%, this will display in green, 31-60% will be displayed in yellow, over 60% will be red.
- Over 85% is green, 60-84% is yellow, and under 60% is red.

Rework Statistics
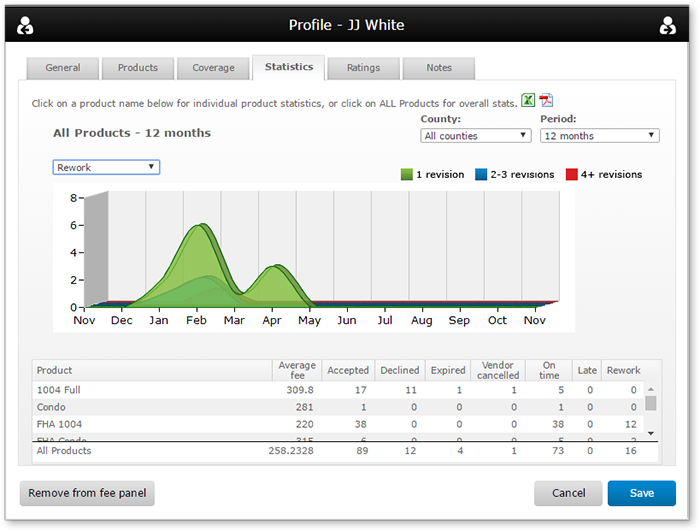
Click the dropdown near the chart and choose rework to see stats on how often your company requested a revision from the vendor.
- The table counts revisions for an order only once. For example, if there were five revisions on the same order, it would only count once here.
- The graph shows how many reports had 1 revision, 2-3 revisions etc, over time using color-coded lines.

Late Reports
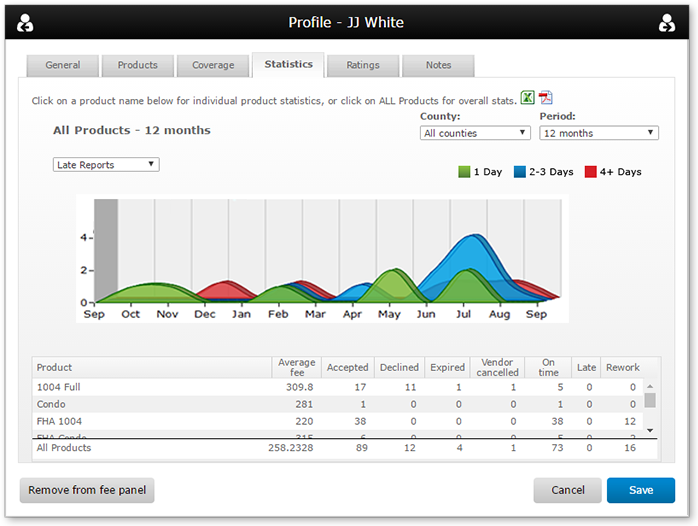
Select Late Reports from the drop down to see how on time a particular vendor is.
- The on-time rate is based on the due date saved in the order.
- Reports are considered late when the due date is less than the date when the appraiser first marks a report as complete. Orders that are put on hold or delayed during the order cycle are excluded.
- Often, the actual due date changes during the course of an assignment, but isn't necessarily updated in the order. To use this statistic reliably, make sure you update your orders when the due date must change.

Mercury
Network and its products are trademarks |