My Panels |
||
The My Panels tab shows you all the fee panels to which clients have added you, plus you can view your stats for these panels as well as auto-accept orders from those clients.
- For each Client Company listed, the Client Stats column may contain a View Stats link which will show you statistics describing your performance with this client. The client has the ability to disable sharing these stats, or if you haven't yet worked with the client, there will not be any stats to display.
- For each client, you can place a check in the Auto-Accept column. With that checked, you'll immediately accept any new orders for that client.
- You can make yourself unavailable for orders for a specific fee panel if you click the Set dates link for that panel, then specify the date range during which you won't accept orders from that fee panel.
- To completely remove yourself from a fee panel, click the red x
in the Remove column for the intended panel. When you do,
the client will be notified, and if you intend to re-join that panel, you'll
need to be re-invited. You need to meet a couple of conditions before you can
remove yourself from a fee panel:
- You can't have any open or pending orders on the intended fee panel.
- You'll need to provide a reason for removing yourself from the fee
panel. That reason will be included on the notification which is sent to the
client.

- AMCs and appraisal firms will see an additional section called Fee
Panel Invitations. There are a couple of things you can do here:
- Enter the email address where you'd like to receive fee panel invitations in the first field.
- Below, in the Response column, you can click
Accept or Decline to respond to the
invitation.

- After you make any changes, click Save in the upper-left to keep your changes.
Reading the statistics
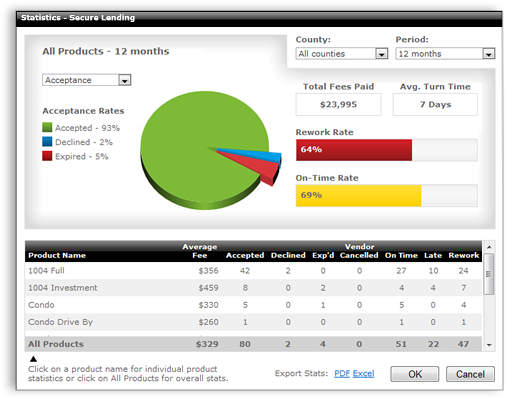
You can navigate through the Statistics window to see the information that's available. Here's how:
- Use the drop-downs on the upper-right to filter by county or time frame
- Click an individual product name from the list at the bottom to filter the graph by that specific product. By default, All Products is selected.
- Click the PDF and Excel links to export the stats currently being viewed for use outside of Mercury Network.
Acceptance Statistics
This lets your clients know how conscientious you are about responding to their orders. When you are responsive, they don’t have to call you or follow-up on their orders. The percentages are color-coded so at a glance you can see how your performance rates.
- If the rework rate is 0-30%, this will display in green, 31-60% will be displayed in yellow, over 60% will be red.
- For the on-time rate - over 85% is green, 60-84% is yellow, and under 60% is red.

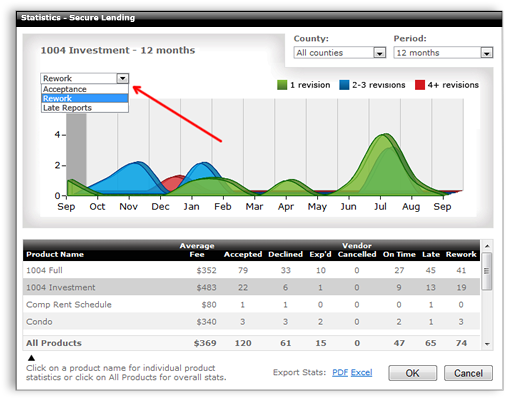
Rework Statistics
Click the drop-down near the chart and choose Rework to see stats on how often the client requested a revision from you.
- The table counts revisions for an order only once. For example, if there were five revisions on the same order, it would only count once here.
- The graph shows how many reports had 1 revision, 2-3 revisions etc, over time using color-coded lines.

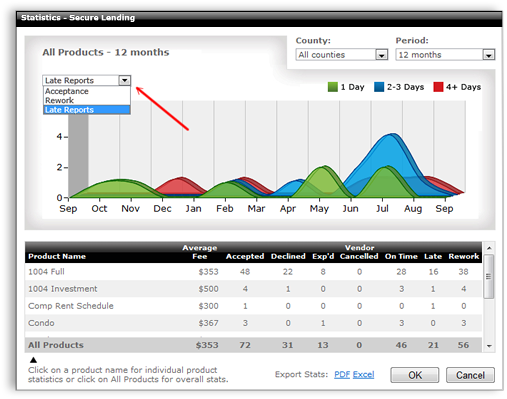
Late Reports
Select Late Reports from the drop down to see your on-time statistics.
- The on-time rate is based on the due date saved in the order.
- Reports are considered late when the due date is less than the date you first marked the order complete. Orders that are put on hold or delayed during the order cycle are excluded.

Mercury
Network and its products are trademarks |